
When a potential customer asks an LLM, like ChatGPT or Gemini, about an industry, the LLM builds its answer from specific phrases and concepts it has learned to associate with your space. Most organizations have no visibility into which phrases the AI actually uses about them. Lenses in Citate’s platform changes that. It lets you search for any phrase used in a statistically significant sample for a prompt. It also lets you know how often that phrase actually appears in AI answers. For example, the phrase “cool handmade hats” might appear in 9% of AI answers for the prompt “What are some things I can buy on Etsy?” Lenses also lets you cluster together multiple phrases into groups. The visibility of all the phrases are then measured in aggregate. E.g., you might create a group called “hats” and follow in aggregate such as “cool hats,” “fun hats,” “inexpensive hats,” etc.
The Citate Topics feature, by contrast, extracts and ranks the most commonly occurring topics across a collection of AI answers for a time period. It uses semantic clustering so that closely related phrases all appear as the same topic. E.g., “inexpensive,” “cheap,” “affordable,” might all be clustered together under the topic “inexpensive.” Ranked topics is incredible for evaluating what’s important to the LLMs. Lenses let you go deeper into exact phrase matching and volumes.
Lenses runs against a campaign. A campaign is a set of AI responses Citate has already collected for your prompts. Two summary tiles sit at the top of the page: the total number of responses sampled, and suggested distinct phrases used in the LLM answers. It also shows closely related distinct phrases clustered together. But you are not limited to just these suggested phrases. You can search for any phrase and create a new cluster group for it or any group of related phrases.
Unlike the Links tab, which catalogs the websites and URLs AI cites, Lenses focuses on the language itself. That means the words, phrases, and concepts the AI reaches for. The two views answer different questions: Links tells you which sources AI trusts; Lenses tells you what AI is actually saying.
The Topic Size slider at the top of the topics table controls how aggressively Citate Lenses recommends phrases you might want to follow.
The Auto setting works for a first pass, then adjust the slider once you know whether you need to zoom out or zoom in. Or type in your own topics to search.
Groups is useful because raw clustering on its own can be overwhelming when a campaign surfaces hundreds of distinct phrases. A lens lets you curate the view.
You can save multiple lenses per campaign with the Default / Save / Save as controls at the top right, then return to any saved view whenever you need it.
Two views below the topics table turn coverage numbers into something more concrete.
The Activity over time chart plots daily mentions for your tracked phrases in the selected window. You can toggle the chart between “By groups” (showing aggregate mentions for each of your saved keyword groups) and “By topics” (showing individual tracked phrases). This is where you see whether the phrases you are tracking are stable, growing, or fading in AI answers.
The Response Viewer below the chart shows the individual AI responses that produced the data, with your tracked phrases highlighted directly in the text wherever an exact match occurs. Each response is dated, paginated, and sourced. This is the layer where you move from statistic to evidence: if “fiduciary duty” sits at 83% coverage, you can read the actual responses that contain it, see the context surrounding each match, and use that framing to inform your content. It is the difference between knowing a phrase gets mentioned and knowing how it gets mentioned.
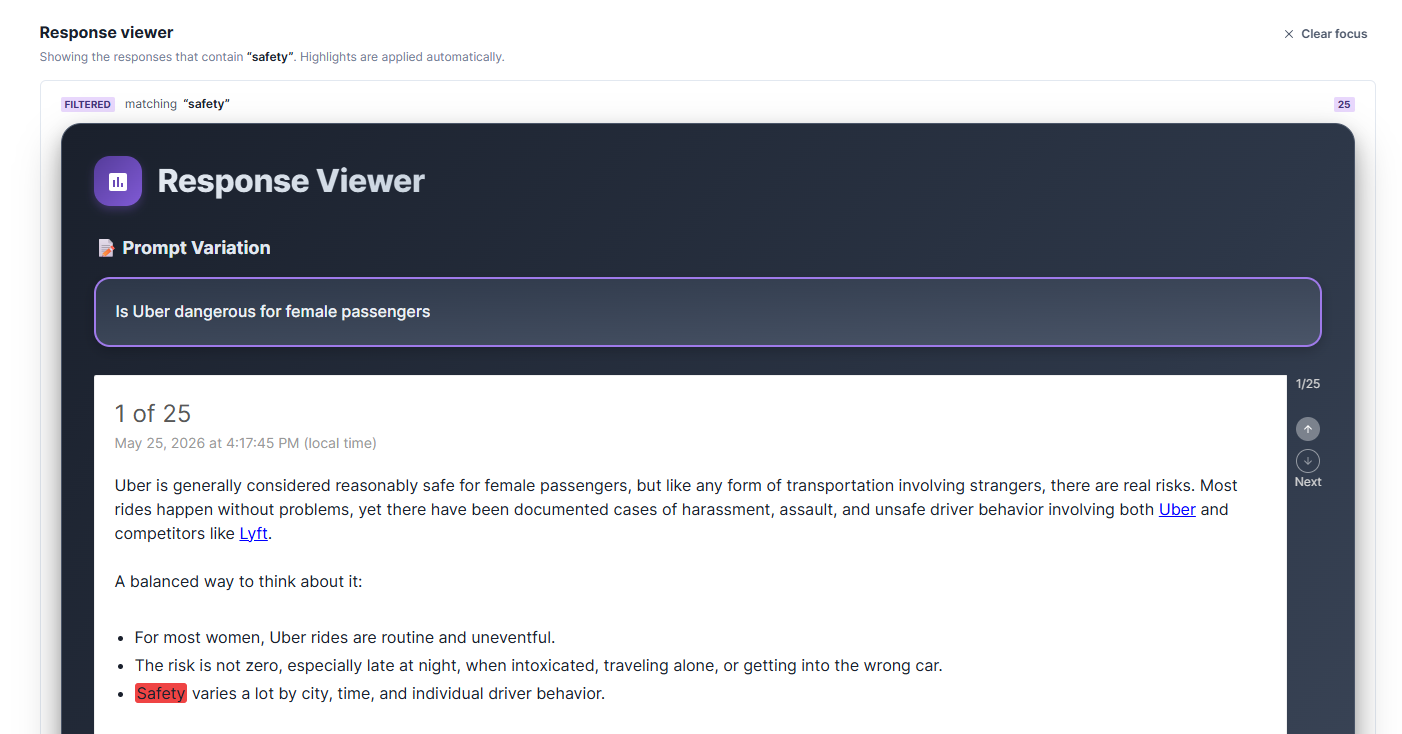
The Response Viewer filtered to responses containing the tracked phrase “safety”. Direct matches are highlighted in the response text, and each response includes a date stamp and citation links so you can trace every claim back to its source.
At the top of the page, a Window selector lets you compute Lenses over a chosen time range: 7d, 14d, 30d, 90d, All, or Custom. Switching windows recomputes the snapshot. Each window is its own computed view rather than a comparison against another window. A “Last computed at” timestamp and a Recompute now button make the data freshness explicit.
Every window shows the same thing — how often your tracked phrases appear in AI responses — just over a shorter or longer period. We recommend working in the 7d or 14d view for day-to-day monitoring. If something you are tracking raises a red flag, such as a phrase suddenly climbing or dropping, switch to a longer window like 30d or 90d to get more accurate trend data before acting on it. As the Citate GEO Guide notes, single-point observations of AI behavior are statistically meaningless. The value comes from sustained measurement over time.
The straightforward workflow is this: decide which phrases matter to your business — brand terms, product names, competitor names, the category language you want to own — and build keyword groups around them. Then open Lenses on a campaign, check the coverage for each group, watch the daily trend chart to see whether the numbers are stable or moving, and read a sample of matching responses in the Response Viewer to understand the context around each mention. Then turn that intelligence into content.
The Content Brief tab picks up directly from here. The phrases your lens shows at high coverage are the natural inputs for hub-and-spoke content planning: they have proven presence in AI answers, a stable or rising trend, and language the AI is already using fluently. A pillar page should address every high-coverage phrase group in the lens. The supporting spoke articles should address the lower-coverage but still-relevant phrases that fill out the question space.
For competitor displacement, build a group containing your competitors’ names and branded terms. When competitors appear at high coverage in AI responses about your category, those are the contexts where your brand should also appear. The Response Viewer shows you the exact responses where competitors are being mentioned, so you can produce content that earns the same mentions.
For content gaps, track the phrases you want AI to associate with your space but that currently show low or zero coverage. Low coverage on a phrase that matters to your audience means no source has claimed that language yet. Quality content built around those phrases tends to move the needle quickly because there is little to compete with.
For reputation monitoring, think about which phrases would be damaging if AI repeated them: mentions of lawsuits, recalls, safety concerns, negative reviews, or an old controversy that should have faded. Build a group around those phrases and Lenses will surface every response that contains them, showing how often they appear and whether they are trending up or down. Catching a damaging phrase while its coverage is still low gives you time to publish corrective content before that language hardens into the default way AI describes your organization.
AI models are probabilistic. The same query run twice can produce different responses. If you ask ChatGPT a question once and base your entire strategy on that single answer, you are building on a sample size of one. That is guessing, not strategy.
Citate solves this by measuring your tracked phrases across hundreds of responses, multiple prompts, and multiple time windows. The coverage you see is the product of statistical sampling, not a single anecdotal answer.
A lens you built six months ago will show different coverage today because the underlying models, search indexes, and discourse have all shifted. Build a saved lens for each strategic question you care about. Check it every two weeks. Watch the daily trend chart for early movement on the phrases you track. Read the Response Viewer when the numbers surprise you, so you understand the why behind the shift.
