CLIENT LOG IN

Citate.ai
  • About Us
    • Our Team
    • AI Code of Ethics
  • What We Do
  • Citate Insights
    • Articles
    • GEO Guide
    • Glossary
  • Getting Started
  • Contact Us
Get In Touch
  • Home
  • Insights
  • Citate Guide: Using The Keyword Visibility Feature To Track Your LLM Visibility

Citate Guide: Using The Keyword Visibility Feature To Track Your LLM Visibility

When a potential customer asks ChatGPT or Gemini which providers they should consider in your category, one of two things happens. Your brand is part of the answer, or it is not. Most organizations cannot say which. The few that check tend to ask once, see one answer, and move on. That is an anecdote, not a measurement.

It cannot be a measurement, because generative engines do not repeat themselves. Ask an AI the same question thousands of times and the answer varies every single time. The brands named, the order they appear in, and the sources cited all shift from one response to the next. Most visibility tools on the market sample each question once a day, and some check only once a week. Against output that variable, a sample that thin cannot provide any measurable confidence.

The Keyword Visibility tab in Citate’s platform is built on the opposite approach. It samples the questions that define your market hundreds of times every week and scores what comes back. How often does our brand show up in AI answers, and where are we positioned in the responses? The Keyword Visibility feature answers that with numbers you can trend over time, benchmark against competitors, and audit down to the individual response.

Understanding How the Keyword Visibility Tab Fits into the GEO/AEO Landscape

SEO matured the moment it could be measured. Rank tracking gave marketers a shared, repeatable number that told them where they appeared on the page, and an entire discipline of testing and improvement grew around it. Generative engine optimization has lacked that foundation. There is no results page to scrape and no fixed position to record. The same question, asked twice, can produce two different answers. Asked in different words, it can produce a different set of brands entirely.

The Keyword Visibility feature is the visibility tracker built for that reality. Instead of recording a single deterministic ranking, it samples: multiple phrasings of the same buyer question, submitted to the model many times a day, every day. Visibility is then reported as a statistical property of the whole sample, meaning how often a brand appears and where it is positioned in the answer, rather than as a one-off observation.

It also anchors the rest of the platform’s intelligence. The Links tab catalogs which sources AI models cite. The Topics feature maps the concepts models treat as essential. Lenses lets you track specific topics. The Keyword Visibility tab answers the question underneath all of them: when it matters, do we actually show up, and where in the answer?

What the Keyword Visibility Tab Actually Shows You

Every visibility campaign in Citate is built around a core question your market asks, such as “What are the best project management platforms for small teams?” Citate queries the model several times an hour. At that cadence, a single campaign accumulates thousands of responses a month, roughly 2,800 in a typical 30-day window.

The Keyword Visibility controls in Citate, showing the date range and Configure panel with calendar and bucket settings, the prompt selector, the keyword chips with independent Frequency and Position toggles, and the Analytics Chart below

Against that sample, the tab tracks the keywords you choose: your brand, the competitors you benchmark against, and any category terms you want to monitor. Each keyword is scored on two independent metrics, frequency and position, and everything on the page can be viewed for all prompt variations combined or for any single variation on its own.

Frequency and Position: The Two Numbers That Define AI Visibility

Frequency: how often you appear

A keyword’s frequency for a given day is the share of that day’s sampled responses in which it appears. A frequency of 90 means the tracked topic appeared in 90% of the answers sampled.

Matching is semantic, not a raw text scan. Citate recognizes that a brand or topic can be mentioned in more than one form, and the Keyword Match Threshold slider lets you control how strict the match threshold should be. At the permissive end, loose and partial matches count. Sliding toward exact requires progressively closer matches. A sensible default is the permissive-to-middle range for brand monitoring, tightening toward exact when a tracked term is ambiguous or doubles as a common word.

Position: how early you appear

Not every mention is worth the same. Position measures where in a response a keyword appears, scored so that higher means earlier. A position score in the 90s means the brand tends to be named in the opening of the answer. A lower score means it surfaces later.

A brand named in the first paragraph is part of how the answer gets framed. A brand mentioned in passing near the end is a footnote to someone else’s framing. Frequency without position overstates your visibility, and position without frequency overstates your consistency. Read together, they describe your actual footprint in the answer.

Reading the Analytics Chart

The Analytics Chart turns those two metrics into trend lines. Each keyword you select plots in its own color, and frequency and position toggle independently per keyword: solid lines show frequency, dashed lines show position. Hovering over any date shows the exact values for everything plotted.

The Time/Duration controls set the observation window. The Configure panel provides a calendar range picker, a bucket setting that controls how data is grouped, and the option to name and save ranges you return to often, such as a quarter, a launch window, or the weeks around a model update. The default one-day bucket is right for close monitoring, while widening the bucket smooths daily noise over longer ranges. One rendering detail is worth knowing. The current day draws as a short dashed segment at the right edge of each line because that day’s sampling is still in progress. Do not read the final point as a sudden drop. It is partial data until the day completes. The chart also exports to CSV for reporting.

The discipline in reading the chart is separating noise from trend. On one-day buckets, individual movements are rarely meaningful, because LLM output is probabilistic and daily wobble is expected. What matters is direction over weeks, like a competitor’s frequency line climbing steadily, your position sliding after a model update, or a category term fading out of answers.

The Quadrant Analysis: Four Strategic Postures

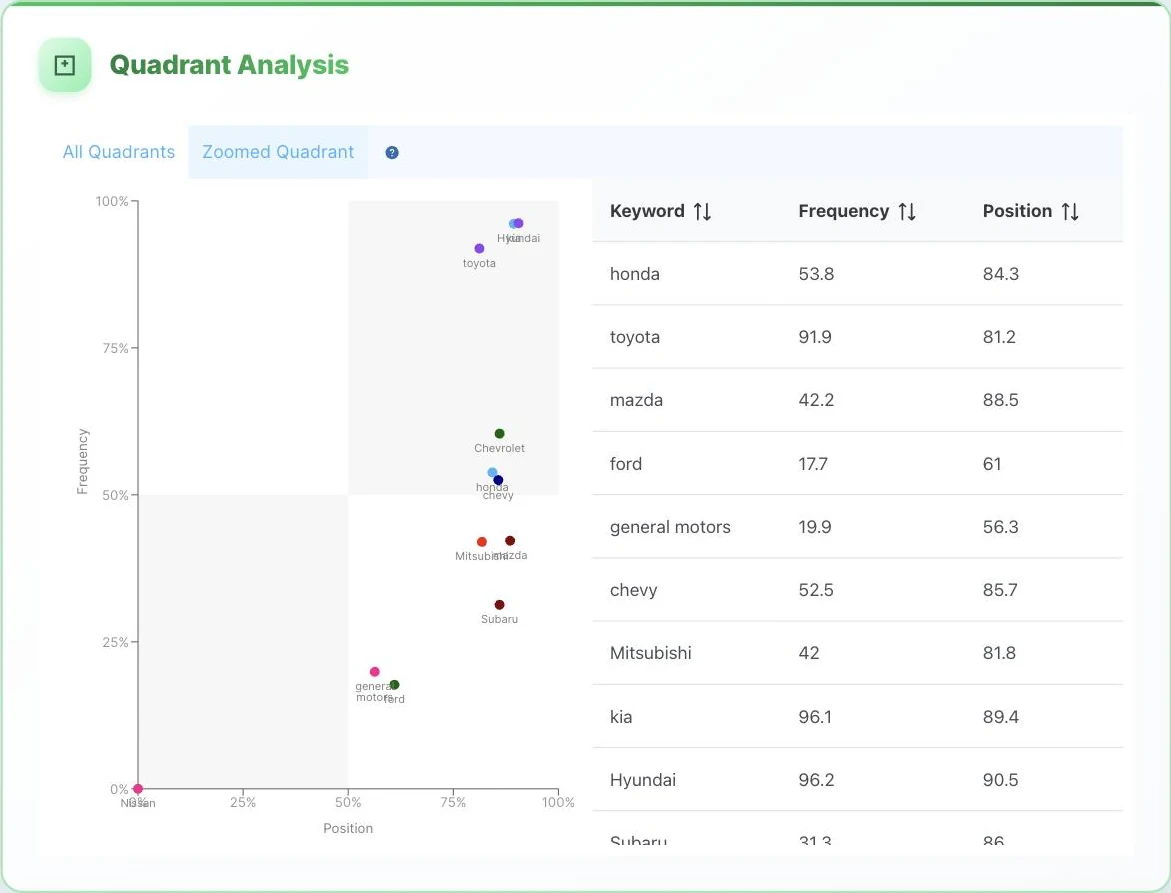
The Quadrant Analysis condenses the whole competitive picture into one chart that plots every tracked keyword with frequency on the vertical axis and position on the horizontal. Up and to the right is better. The Zoomed Quadrant view focuses on the region where your keywords actually cluster, so close scores stay readable. The All Quadrants view zooms out to the full grid. A sortable table alongside lists each keyword’s frequency and position scores for the selected period.

The Quadrant Analysis in Citate, showing tracked keywords plotted by frequency and position with the sortable score table beside the chart

The four quadrants describe four strategic postures:

  • High frequency, high position. The model treats this brand as a category default: named early, named often. If this is you, the work is defense, maintaining the topical authority and citation base that put you here.
  • High frequency, low position. Mentioned but buried. The model knows this brand belongs in the conversation but rarely leads with it. The brand is reliably present as an also-considered but rarely the frame. The lever here is prominence, strengthening the signals that pull a brand into the opening of answers, from the anchoring topics identified in the Topics guide to the sources mapped in the Links guide.
  • Low frequency, high position. Prominent but rare. When this brand appears, it appears early, which is often a sign of real strength in a narrower slice of the question space. The task is widening that presence without diluting it.
  • Low frequency, low position. Effectively invisible. The model does not consider this brand part of the answer. This calls for foundational GEO work rather than optimization at the margins.

Because your competitors sit on the same grid, the chart makes competitive reality legible at a glance. You can see who owns the category, who is drifting, and who is climbing into contention.

The Response Viewer: The Receipts Behind Every Number

An aggregate you cannot audit is an aggregate you cannot fully trust. Below the charts, the Response Viewer holds every individual response behind the metrics, all of the roughly 2,800 in a typical monthly window, so any number on the page can be traced back to the raw answers it came from.

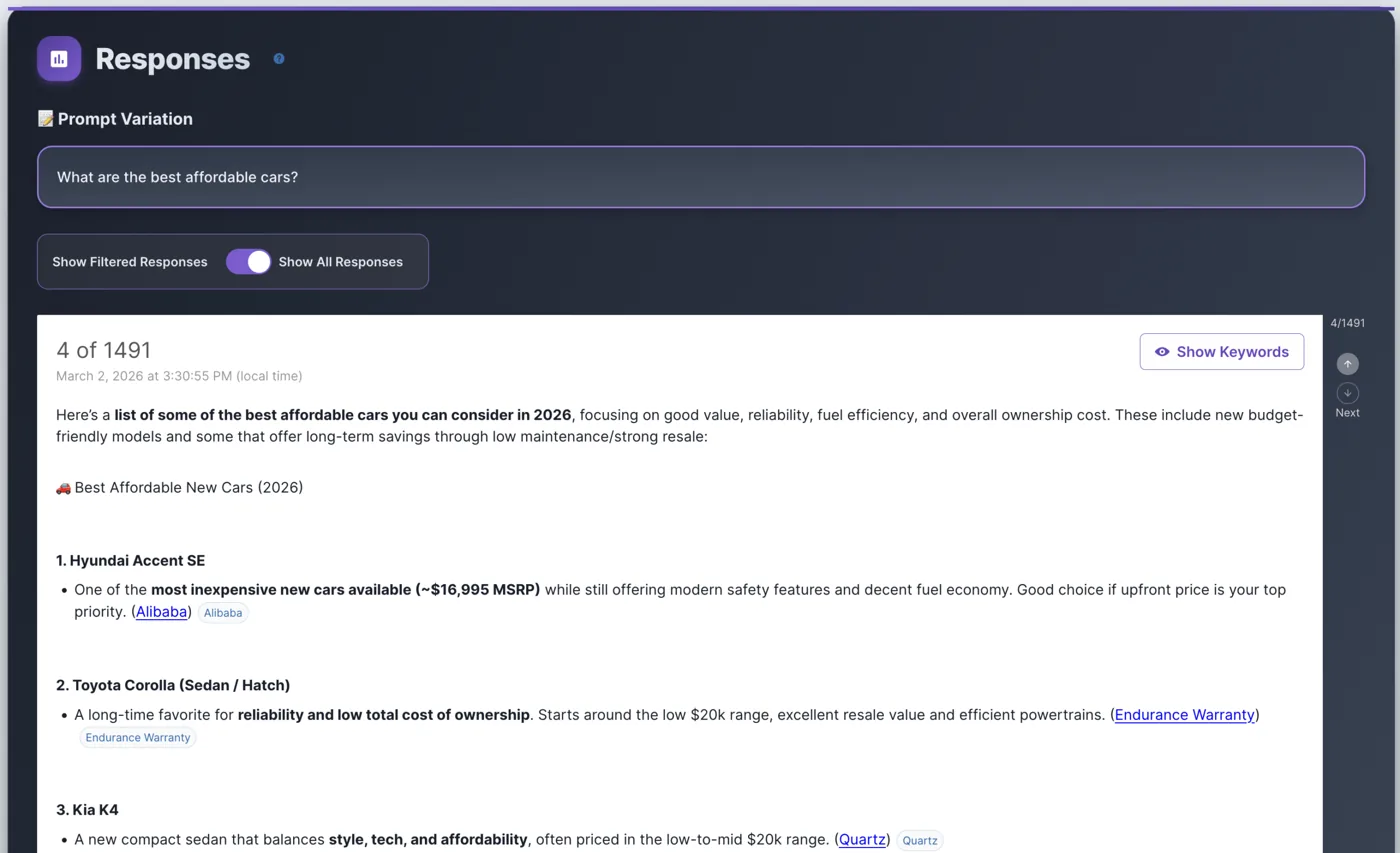
The Response Viewer in Citate with Show Keywords enabled, showing a full response with the side panel listing each keyword's match level and count

Each response card shows the date and time it was collected, with the full response rendered exactly as it was delivered, including its formatting and tables. Cited sources appear inline as expandable chips. Clicking a source’s details reveals the title of the cited page, a SOURCES list collects every citation in the response, and a meta link opens the complete raw metadata behind the response, from citation URLs to snippets and attributions.

The Show Keywords control connects the responses back to the metrics. It highlights every tracked keyword in the text and opens a panel listing each keyword found in that response, its match level, exact or partial, and how many times it appeared. This is semantic matching made inspectable. You can see exactly what counted as a match at your current threshold setting, one response at a time.

The viewer has two modes. Show All Responses browses the entire sample. Show Filtered Responses narrows the sample to responses containing the keywords currently selected in the controls above. That enables the single most useful qualitative exercise in the tab. Select your brand, filter, and read fifteen responses. You will learn how the model frames you, which competitors it names alongside you, and which sources tend to travel with your mentions. When a chart moves and you want to know why, the answer is here rather than in the aggregate. Read the responses from the window where the line moved and see what changed. And when phrase-level patterns have been identified you can monitor them using the Lenses feature.

Why Ongoing Monitoring Matters

Visibility in AI answers is not a fixed asset. Models update, competitors publish, sources rise and fall in the citation graph, and a quadrant position that took a year to earn can erode in a quarter. Like every dataset in the platform, keyword visibility has a shelf life, which is why the Keyword Visibility feature is built for monitoring rather than one-time audits.

A workable cadence is to check the chart and the quadrant weekly for each campaign that matters, holding the match threshold constant so numbers stay comparable over time. Monthly, go qualitative. Filter the Response Viewer to your brand and read. And when the data exposes a gap, whether that is a question where you are invisible, a competitor pulling ahead, or a position score that never leaves the basement, the links feature can help you track what content is cited by the LLM and which 3rd party sites are influencing the LLM responses.

The organizations that win visibility in generative engines are not the ones that check occasionally and hope. They are the ones that treat AI answers as a measurable channel. They baseline it, trend it, investigate it, and improve it deliberately. The Keyword Visibility tab exists to make that possible. You cannot improve a number you never measure.

Author

  • Citate.ai
    Citate.ai

    Citate.ai is a Reputation Technology company helping organizations measure, understand, and shape their AI narrative with scientific precision.

Get In Touch

    CLIENT LOG IN                      

    ©2026 CBI.ai, Inc. All Rights Reserved. Patent protected. 

    • Contact Us
    • Terms
    • Privacy Policy